Our dashboard has been updated to include various features and options, including the possibility of viewing detailed stats on the functioning our Privacy Controls and Cookie Solution.
You can access the above in your dashboard by clicking on the Privacy Controls and Cookie Solution Analytics tab.
Please note:
- Detailed analytics of user preference and consent activities are only available for Ultimate plans. They include page view metrics, consent rate and consent drilldown (like rates of scrolling, notice closure, clicks on buttons and links, closing of policies and more).
- 💡 Are you already an iubenda customer and considering an upgrade to our Ultimate plan? Here’s why it’s worth it! When you switch to Ultimate, you’ll gain access to detailed website stats like consent rates. Plus, you’ll unlock all your historical data—even from when you signed up for iubenda and were on a lower-tier plan. 🚀 Upgrade today to gain valuable insights!
- If you joined iubenda before 2023 and are on our old pricing model with license slots, please be aware that available features depend on the plan you have chosen: you can see both account overall stats and single website stats if you cumulate at least 300k pageviews/months for that site. Basic plans only include overall account stats.
Account stats
❗️ Please note that this chart will only be available to users with old prices, as for other users this information is in more detail in the Pageview summary graph.
Let’s take a detailed look at how these features work. By clicking on “Account stats” you will be able to view various graphs.
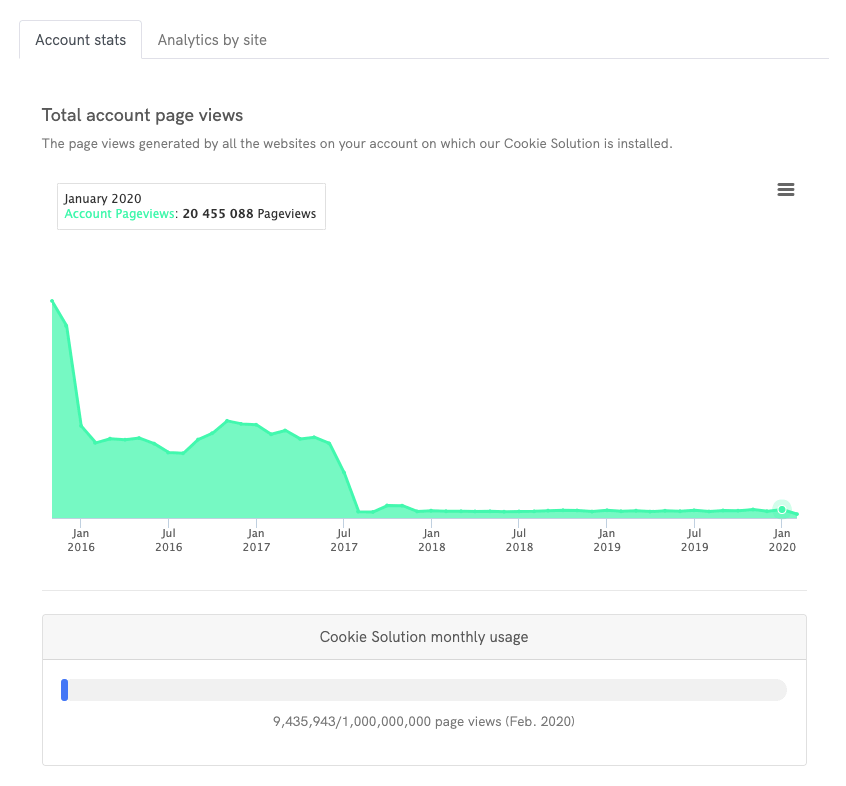
Total account pageviews
The first chart is a summary of monthly usage as per your Privacy Controls and Cookie Solution plan limits, followed by the total number of pageviews for the entire account, which is useful for a quick overview over time.
How to interpret the analytics
The graph above shows the summary of monthly usage as per your Privacy Controls and Cookie Solution plan limits, followed by the total number of page views for the entire account, which is calculated after your page views for that month exceed 25.000. The total number of page views is calculated by preference found* + preference not found*.
*Preference found = Action previously made (meaning the cookie banner is not shown)
*Preference not found = No action previously made (Cookie banner shown)
Please keep in mind: When opening the CSV in excel, depending on your language, you may need to change the decimal separator symbol in your excel settings.
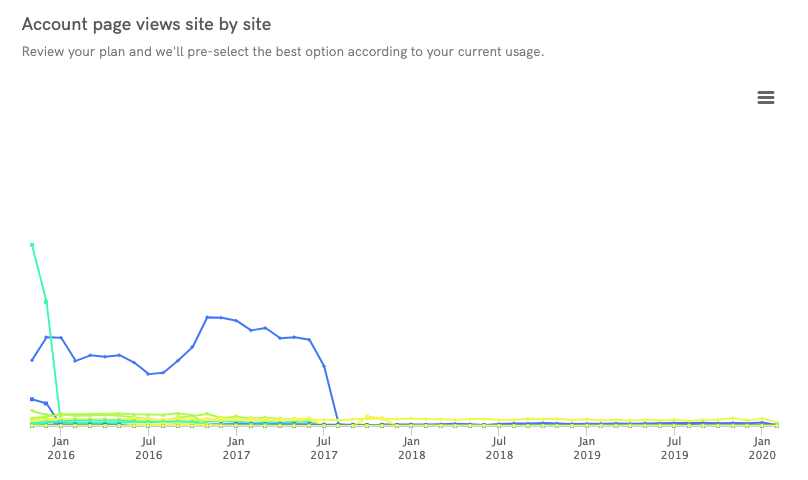
The second graph is useful for comparing the pageviews generated by each single website within your account. It can help you understand at a glance which website is impacting more on overall traffic.
How to interpret the analytics
The graph above compares the pageviews generated by each site/ app in the account. The total number of page views is calculated by preference found* plus + preference not found*
*Preference found = Action previously made (meaning the cookie banner is not shown)
*Preference not found = No action previously made (Cookie banner shown)
Please keep in mind: When opening the CSV in excel, depending on your language, you may need to change the decimal separator symbol in your excel settings.
Analytics by site
The “Analytics by site” tab allows you to focus on a single website: near the top of the tab you can find a pulldown menu for selecting it.
Key indicators
As you move down the page, you will see two graphs: the first one represents the traffic covered, while the other one represents the percentage of consent compared to how many times the consent notice was prompted.
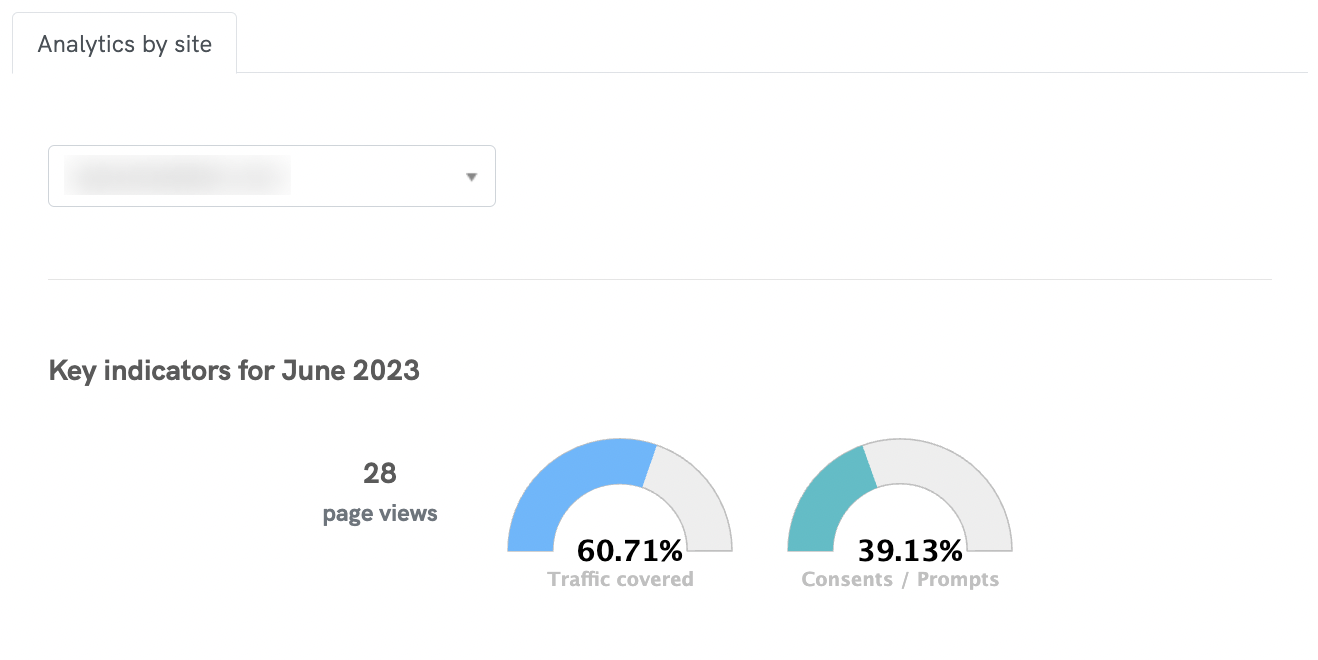
How to interpret the analytics
The first indicator shows the total number of page views for your website that month. The total number of page views is calculated by preference found* + preference not found*.
The first semicircular chart on the traffic covered shows the percentage of your total traffic that is covered by consent.
*Preference found = Action previously made (meaning the cookie banner is not shown)
*Preference not found = No action previously made (Cookie banner shown)
*Preference found accepted = Action previously made (Cookie banner was accepted)
*Preference found rejected = Action previously made (Cookie banner was rejected)
The second semicircular chart represents the percentage of consent compared to how many times the consent notice was prompted. Note that if the same user navigates your site without expressing a preference, each of these views will be counted as separate.
Please keep in mind: When opening the CSV in excel, depending on your language, you may need to change the decimal separator symbol in your excel settings.
Pageview summary
The following graph shows a summary of all the pageviews served on this website in the last months, divided into categories: Total, Preference found, Preference not found, Rejection found, Consent found, Bounced, New consent rejected, New consent collected, Full consent, Partial consent and Rejected/bounced consent.
How to interpret the analytics
The graph above on the summary of all the pageviews served on this website shows the total number of page views. The total number of page views is calculated by preference found* + preference not found*. It also shows any recently collected data. Any recent data collected recently is calculated by preference found accepted* + Preference found rejected*.
1st column
-
*Total = This includes all the pageviews from the website, both with or without preference already expressed
2nd column
-
*Preference found = Action previously made (meaning the cookie banner is not shown)
*Preference not found = No action previously made (Cookie banner shown)
3rd column
-
*Preference found accepted = Action previously made (Cookie banner was accepted)
*Preference found rejected = Action previously made (Cookie banner was rejected)
*Bounced = This includes the pageviews where no interaction with the displayed cookie banner was done, therefore no preference has been expressed. This does not include pageviews where the preference has already been expressed (cookie banner didn’t appear)
*New consent collected = This includes the pageviews where a new preference has been expressed in any form and any interaction. This one does not include consent rejections
*New consent rejected = This includes the pageviews where a new preference has been expressed with a refusal
4th column
-
*Full consent = This includes all the pageviews from the website where the preference resulted in a consent given with all categories accepted. Both with preference already expressed and newly expressed
*Partial consent = This includes all the pageviews from the website where the preference resulted in a consent given with some categories accepted. Both with preference already expressed and newly expressed
*Rejected/ bounced consent = This includes all the pageviews from the website where the preference resulted in a consent refusal. Therefore no category was accepted. Both with preference already expressed and newly expressed. This also includes bounced pageviews.
Please keep in mind: When opening the CSV in excel, depending on your language, you may need to change the decimal separator symbol in your excel settings.
Consent rate
Further on we find the “Consent rate” graph. It can be used to understand how many new consents are given per day/week/month, and thus how many users visit your website.
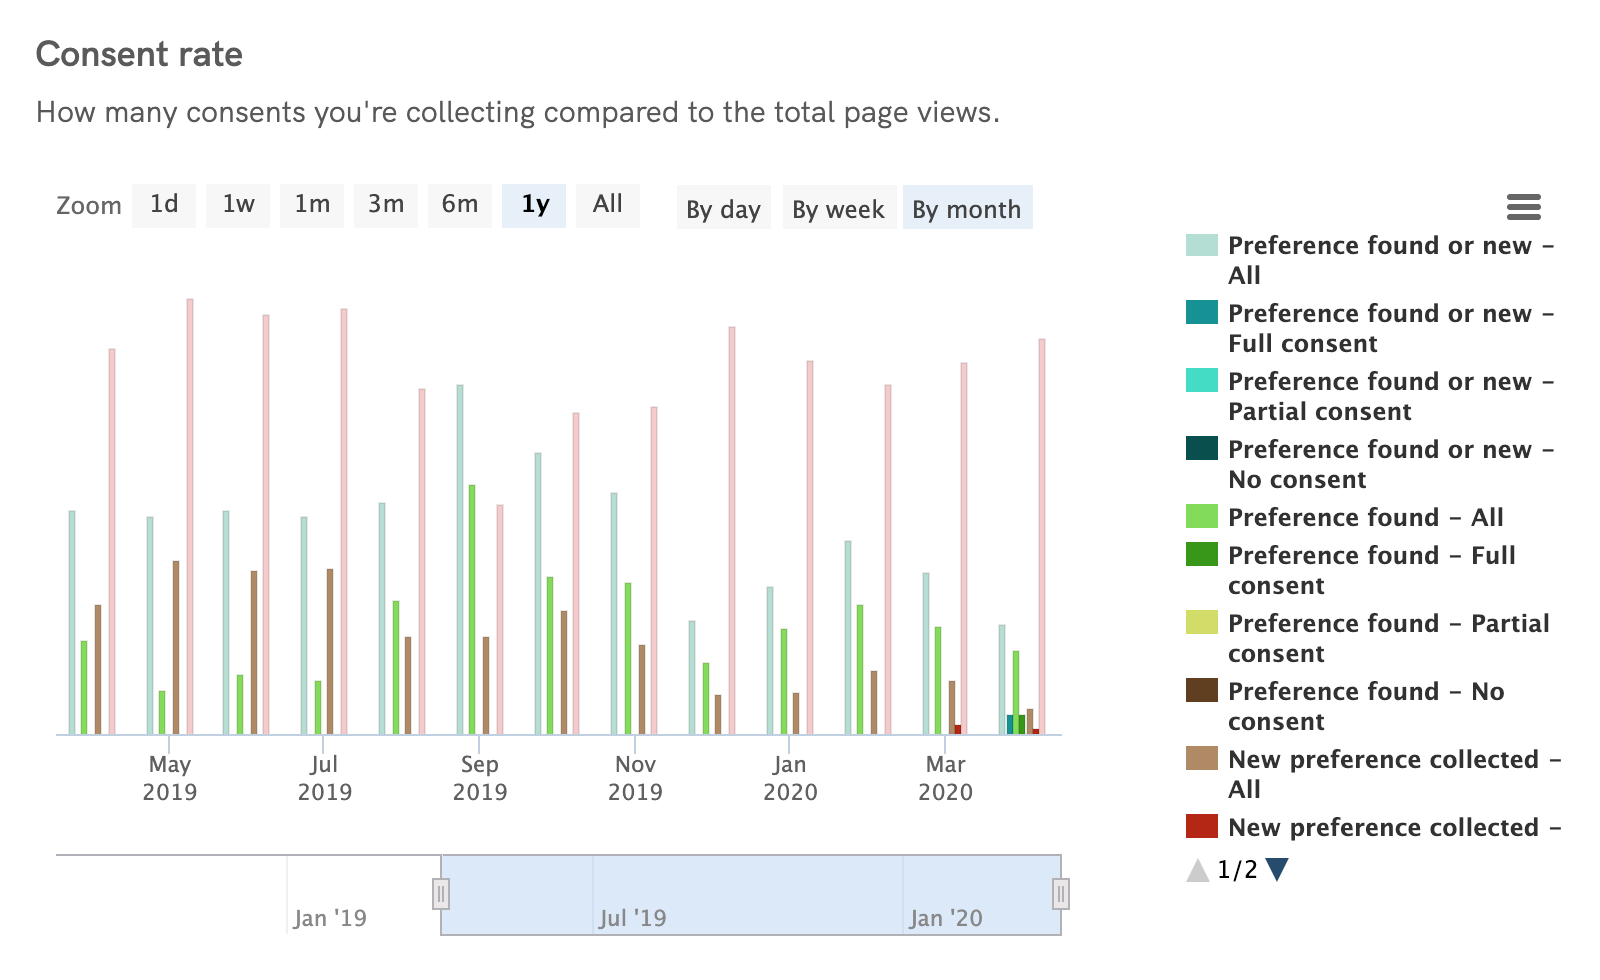
How to interpret the analytics
The graph above shows how many new consents are given. This is a breakdown of the percentage of the total number of page views. The total number of page views is calculated by preference found* + preference not found*. Please keep in mind that the percentage of bounced pageviews* is not shown.
*Preference found = Action previously made (meaning the cookie banner is not shown)
*Preference not found = No action previously made (Cookie banner shown)
*Bounced pageviews = page was accessed and no action was taken.
Please keep in mind: When opening the CSV in excel, depending on your language, you may need to change the decimal separator symbol in your excel settings.
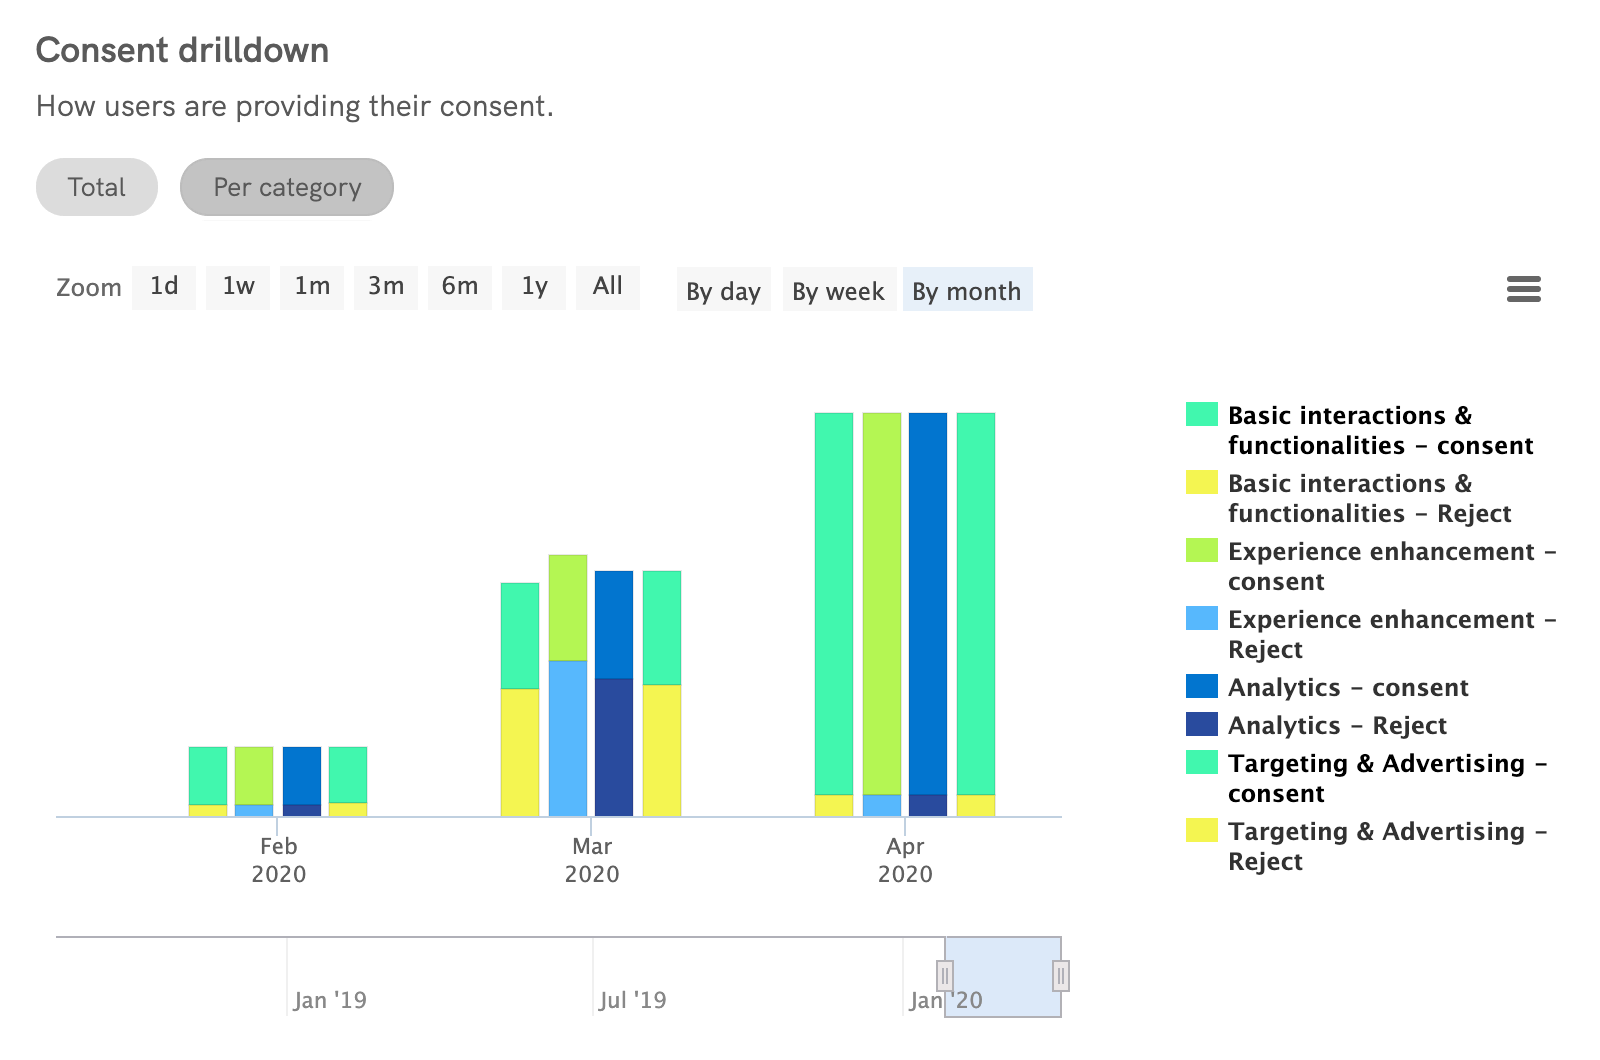
Consent drilldown
Finally, the last section shows a detailed analysis of collected consents. Here you can at a glance understand the manner in which the consent was obtained:
- Scroll – the simplest way;
- Banner closure – by clicking on the [x] at the top right;
- Click on links and buttons – by this we mean clicking on a link or a button inside the page, this can also be understood as a continuation of browsing;
- Closing the cookie policy – by far the least used way to give consent, it consists in viewing the policy linked inside your banner and closing it;
- Click on the “Accept” button inside the cookie banner;
- Click on the “Reject” button inside the cookie banner.
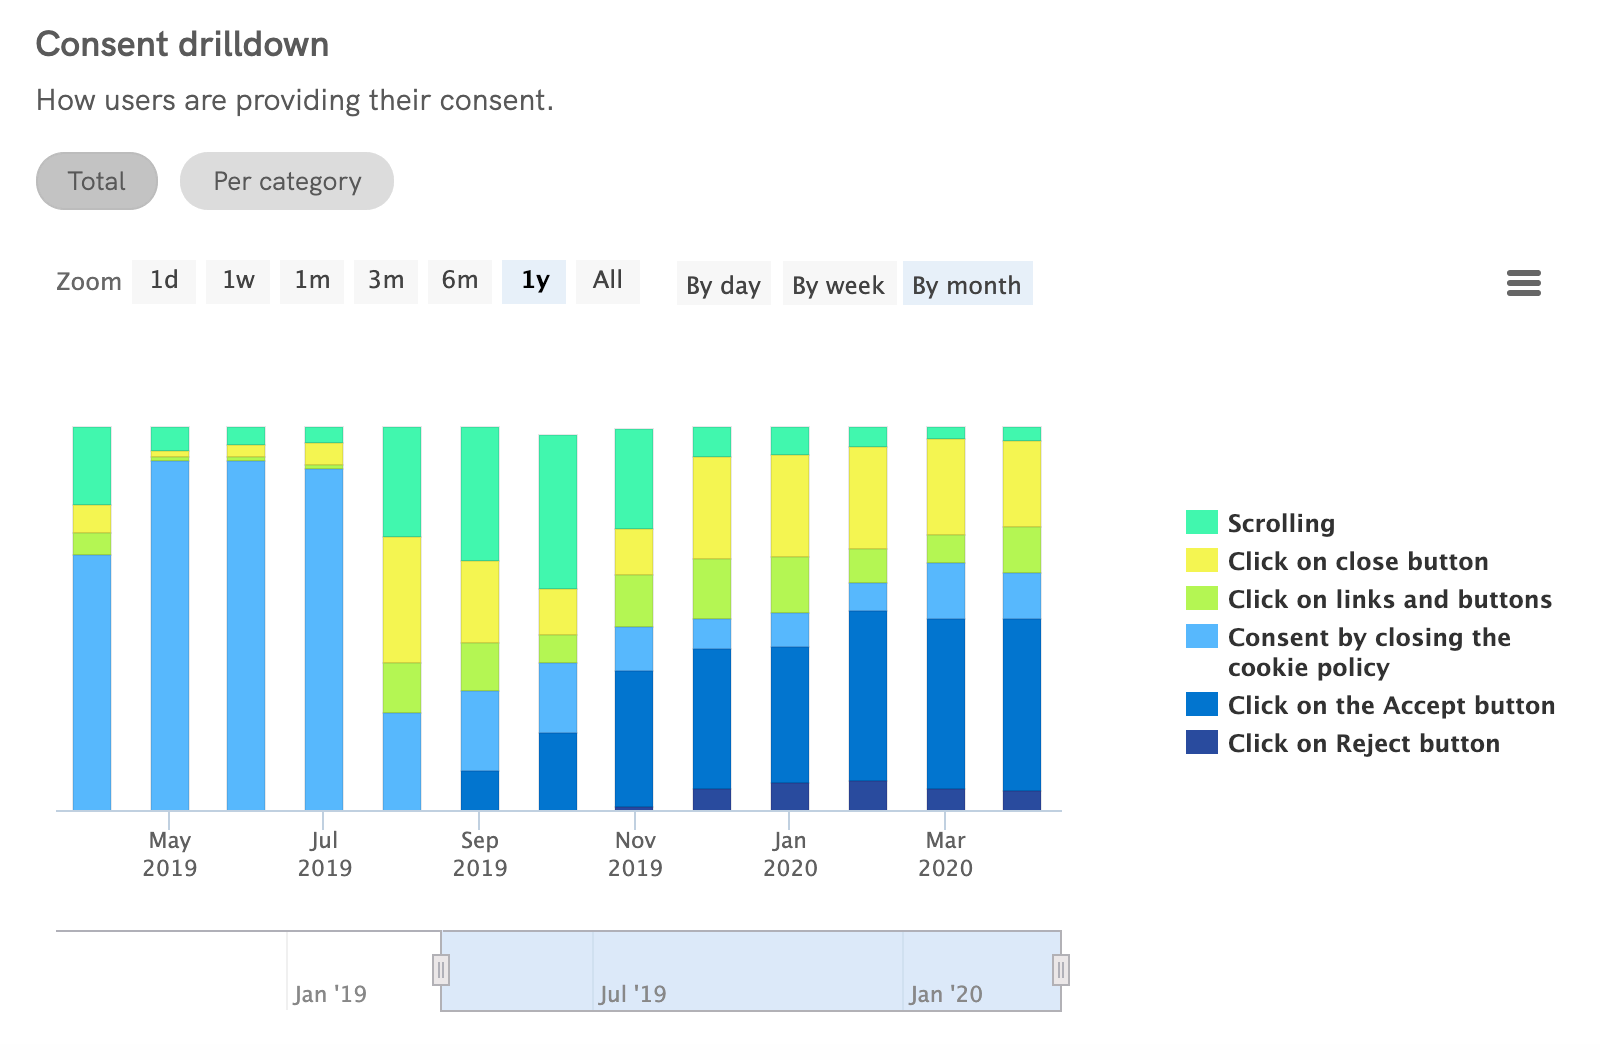
How to interpret the analytics
The graph above shows a detailed analysis of collected consents. This is a breakdown of how the user interacted with the cookie banner. This percentage is given based on the total number of page views. The total number of page views is calculated by preference found* + preference not found*.
*Preference found = Action previously made (meaning the cookie banner is not shown)
*Preference not found = No action previously made (Cookie banner shown)
Please keep in mind: When opening the CSV in excel, depending on your language, you may need to change the decimal separator symbol in your excel settings.
If you have enabled the per-category consent feature, you will also see a second graph containing an analysis of the consents grouped by category.